


As a new interactive map shows the world’s most environmentally friendly people, we explore the climate change heroes and villains based on CO2 emissions, energy consumption, waste and air pollution.
With a climate change ‘doubter’ currently occupying the White House, those of us who care about the environment have had cause for real concern during the course of the last few weeks. When trouble potentially lies ahead, it pays to take stock of the existing situation, and a fascinating new study from price comparison website, MoneySuperMarket, helps to visualise the way people across the world impact upon the environment.
One of the biggest ‘baddies’ when it comes to climate change is CO2; it may be a naturally occurring gas, but humans have significantly increased its production during the past 200 years, which means that the Earth’s natural coping and cleaning mechanisms are now unable to manage, leaving us with increasingly acidic oceans and a warming planet. It’s hardly surprising then, that CO2 emissions played a role in the MoneySuperMarket rankings. What is surprising is the distribution of CO2 production.
While one would expect the worst CO2 culprits to be the most populous countries, it would seem that tiny little Trinidad and Tobago, with a population one sixty-fourth the size of the UK and more than 300 times smaller than the USA, produces more CO2 per person than anywhere else on the planet. How does this play out in numbers? The people of these two small islands produce 37.1 tonnes of CO2 per person per year, that’s 118 per cent more than the United States. It’s a bit of a shocker. Equally surprising is that Australia, a country well-known for its green credentials, doesn’t fare much better, with ## tonnes of CO2 per person per year, far exceeding all of its European counterparts.
Energy consumption was another contributing measurement. While Mozambique topped the ‘good list’, using almost 100 per cent green energy, the survey revealed that the majority of Europeans sat in the middle ground. While Britons use 57 percent less energy than Americans – and that energy is 77 percent greener – the likes of Luxembourg (#%) and Norway (#%) were still pretty power-hungry. Despite the obvious correlation, the thing that most people don’t think about is the fact that in reducing their energy consumption they can also reduce their expenditure, and that’s even before the savings they could make by shopping around and switching tariffs. Saving money while saving the environment seems like an obvious win-win.
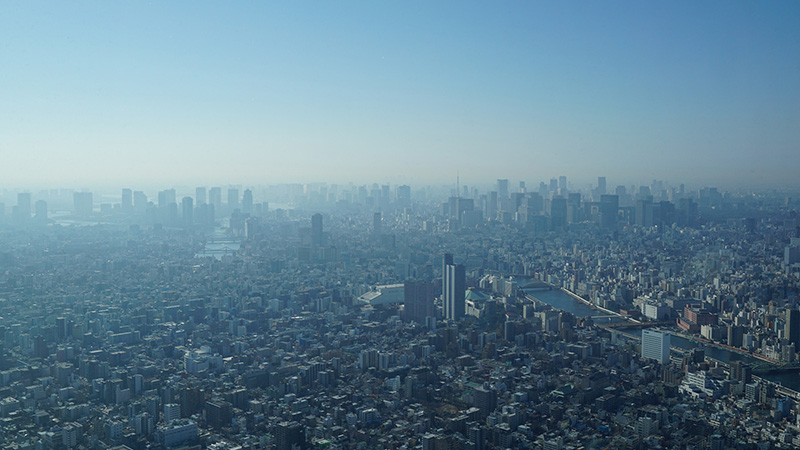
When it came to air pollution, not surprisingly, China and its infamous smog topped the climate change charts, with Bangladesh, Pakistan, India and Nepal following closely behind. Again, most European countries sat in the middle ground, with Australia and New Zealand able to pick up the bragging rights for cleanest air.
Each of the other criteria which made up the survey – including water treatment, tree loss, green energy and solid waste – produced relatively predictable results, with the likes of Eritrea destroying the most forest land and Europe being among the best for waste water treatment. Final ranking is a case of swings and roundabouts, with the UK, for example, earning a glowing endorsement for treating the vast majority of its waste water, but losing significant points because only 22 percent of the energy made and used by the nation is of green origin.
The combined results from each criterion within the MoneySuperMarket survey revealed that on average, Europeans are doing pretty well when it comes to tackling climate change. While the UK, home of MoneySuperMarket, ranked 53rd overall, boasting a greener population than France (rank), Germany (rank) and even Australia (rank) and New Zealand (rank), there is still room for improvement if the population wish to compete with the greenest of the green. That crown goes to the people of Mozambique, who along with their stellar green energy production can be proud of the fact that they produce almost no carbon dioxide and create almost no waste.

Leave a Comment