

Key takeaway
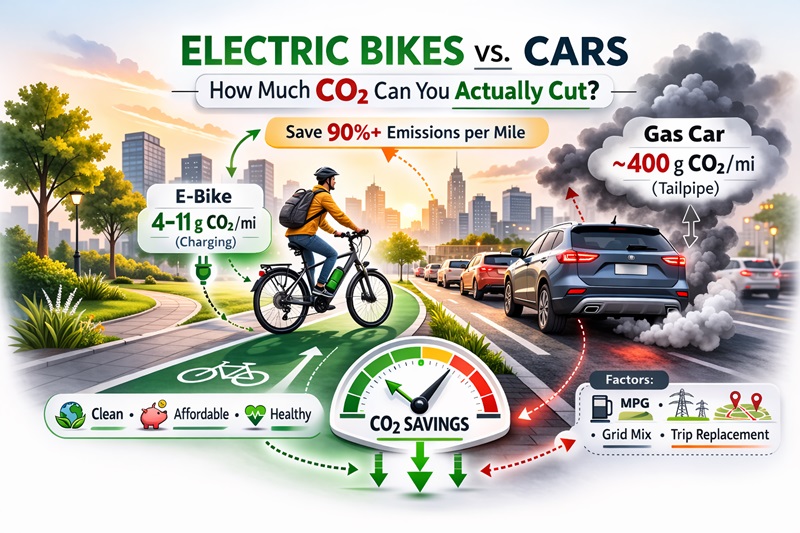
For the short, everyday trips that make up a big share of driving, switching from a gas car to an e-bike is usually one of the highest “CO₂ saved per mile” choices you can make—often cutting emissions by well over 90% per mile when you compare tailpipe CO₂ from a typical U.S. passenger vehicle to the electricity used to charge an e-bike. The exact percentage depends on your car, your local power grid, your riding style, and how often the e-bike replaces a car trip.
One-line answer (snippet-ready): On the average U.S. grid, e-bike charging often lands in the single digits to low teens grams of CO₂ per mile, versus roughly ~400 g CO₂ per mile tailpipe for a typical gasoline passenger vehicle—so emissions are often 90%+ lower per mile when the ride truly replaces a car trip.
Why short trips are where e-bikes shine
A large share of car trips are short, local, and repeatable—errands, school runs, quick commutes, and “last mile” connections. Those are exactly the trips where an e-bike can substitute without needing heroic motivation or perfect fitness.
Short trips are also where cars tend to perform worst: frequent stops, idling, and cold starts can increase fuel use per mile compared with steady highway driving. That means the “per mile” tailpipe baseline used for comparisons can be conservative for many real-world urban trips.
How we estimate emissions
To keep this practical and defensible, this article uses two lenses:
- Tailpipe CO₂ for gas cars (what comes out of the exhaust while driving).
- Charging emissions for e-bikes (CO₂ from generating the electricity used to charge).
- Lifecycle context (manufacturing + maintenance + battery impacts) is discussed separately because it’s real—but it’s not the same boundary as tailpipe emissions.
Assumptions for the examples (you can swap in your own numbers in the calculator below):
- “Typical passenger vehicle” tailpipe CO₂: ~400 g CO₂ per mile (EPA)
- U.S. average electricity CO₂ intensity: ~0.81 lb CO₂ per kWh (EIA, 2023)
- Typical e-bike energy use: ~10–30 Wh per mile (varies with speed, hills, rider input, tire pressure, cargo, and assist level)
Method boundaries (what’s included)
There are two common “boundaries” for comparing transportation emissions. This article mostly uses the first because it’s simple and matches how many people think about day-to-day choices.
- Operational emissions (main math):
- Gas car: tailpipe CO₂ (exhaust while driving)
- E-bike: charging CO₂ (power plant emissions tied to electricity used)
- Well-to-wheel / lifecycle (context):
Includes upstream fuel production (oil extraction/refining for gas) and manufacturing (vehicles + batteries). These matter, but they’re a different accounting boundary than “tailpipe vs charging.”
If you prefer a strict apples-to-apples comparison, you can add upstream fuel emissions for gasoline and manufacturing for both. The main takeaway usually stays the same: e-bikes are extremely low per mile, especially when they replace car trips.
Car emissions baseline (EPA), plus the g/km conversion
The EPA’s “typical passenger vehicle” estimate is about 400 grams of CO₂ per mile at the tailpipe.
Quick conversion:
- 400 g/mile ÷ 1.609 = ~249 g/km
So a simple baseline for comparisons is:
- Typical gas car (tailpipe): ~400 g CO₂/mile (~249 g/km)
Quick fairness check: per passenger-mile
A car sometimes carries more than one person. If you want emissions per passenger-mile, divide the car’s per-mile emissions by the number of occupants.
- Solo driver: baseline stays the same
- Two occupants: per passenger-mile is roughly half
- Three occupants: roughly one-third
E-bikes are usually one rider, so this adjustment mainly matters when comparing to carpools.
E-bike emissions: not zero—usually very low
Operational (charging) emissions on the average U.S. grid
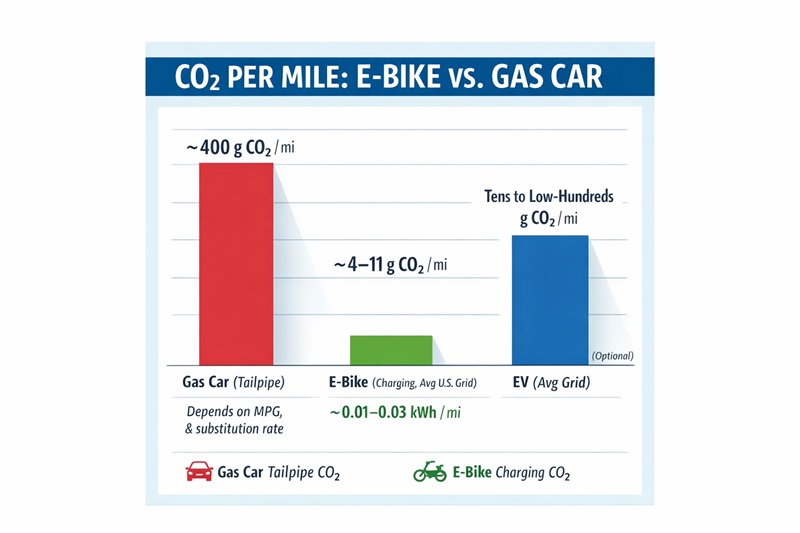
If an e-bike uses 10–30 Wh per mile, that’s 0.01–0.03 kWh per mile. Using the EIA’s U.S. average 0.81 lb CO₂/kWh (~0.367 kg CO₂/kWh), charging emissions come out roughly:
- Low end: 0.01 kWh/mi × 0.367 kg/kWh = 0.0037 kg/mi ≈ 3.7 g CO₂/mi
- High end: 0.03 kWh/mi × 0.367 kg/kWh = 0.0110 kg/mi ≈ 11.0 g CO₂/mi
That’s typically ~4–11 g CO₂ per mile from charging on the average U.S. grid—versus ~400 g CO₂ per mile tailpipe for a typical car.
Lifecycle (manufacturing + battery) context
E-bikes still have emissions from producing the frame, electronics, and battery. One peer-reviewed lifecycle study reports an e-bike around ~22 g CO₂-eq per km (with assumptions that can change the number). That’s still far below typical car emissions, but it’s a reminder that “zero” isn’t the right word outside of narrow definitions.
Bottom line: e-bikes aren’t zero-emission in a full lifecycle sense, but they are typically very low-emission per mile, especially when they replace car trips.
E-bike vs EV vs gas: energy use per mile (why the gap is so large)
A useful way to understand the difference is energy per mile. Bikes (even electric ones) move far less mass and face less rolling resistance than cars.
Typical energy intensity (order-of-magnitude):
- E-bike: ~10–30 Wh per mile
- Electric car (EV): often a few hundred Wh per mile (varies by model, speed, and weather)
- Gas car: not measured in Wh/mi, but translates to much higher energy per mile due to engine inefficiency
What this means: EVs can be a major improvement over gas, but electric bike can be even more efficient per mile because they use so little electricity. The “best” option depends on the trip: e-bikes dominate short trips; EVs matter for longer trips where bikes aren’t practical.
Calculator: estimate your annual CO₂ savings
Use this to estimate tailpipe CO₂ avoided when an e-bike replaces car miles.
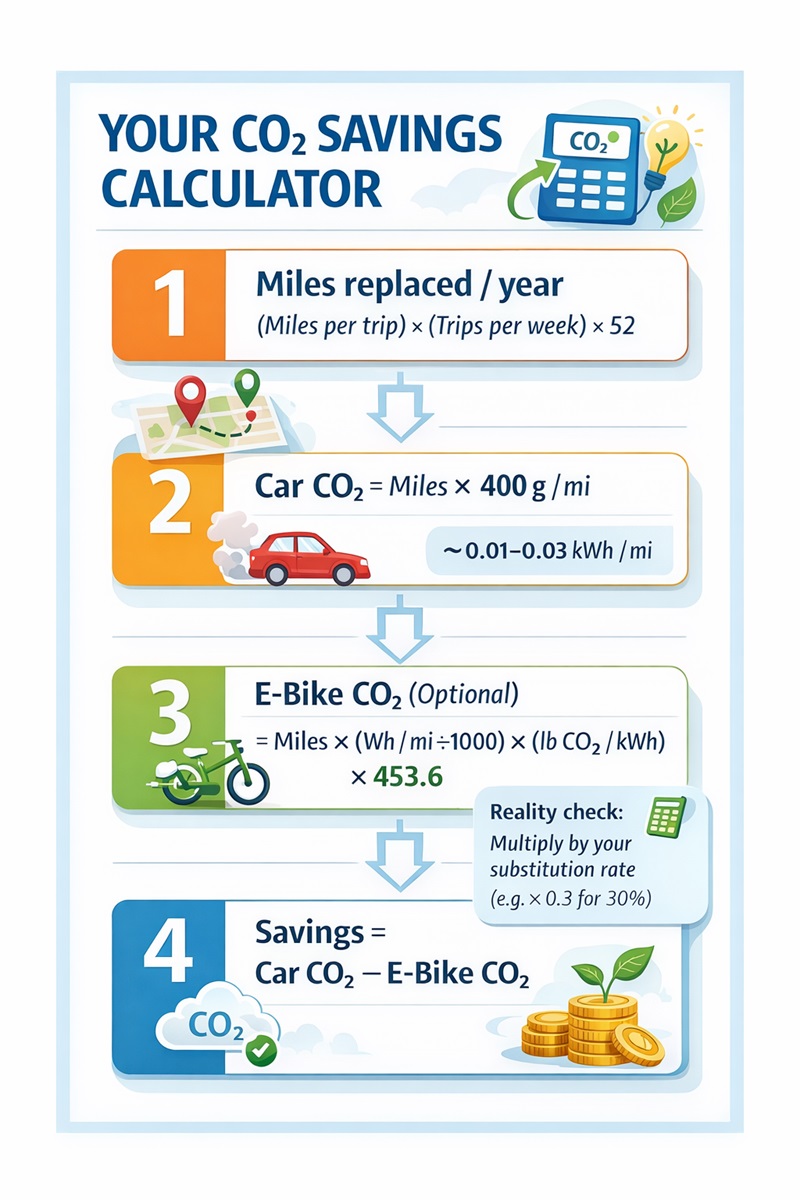
Step 1: Calculate annual miles replaced
Annual miles replaced = (miles per trip) × (trips per week) × 52
Step 2: Estimate car CO₂ for those miles
A simple baseline:
- Car tailpipe CO₂ = annual miles replaced × 400 g/mile
(If you want to be more precise, use your car’s MPG and grams CO₂ per gallon—but EPA’s baseline is fine for editorial comparisons.)
Step 3: Estimate e-bike charging CO₂ (optional but helpful)
- E-bike CO₂ = annual miles replaced × (Wh/mile ÷ 1000) × (lb CO₂/kWh) × 453.6 g/lb
Step 4: Savings
Savings (g CO₂) = Car CO₂ − E-bike CO₂
E-Bike vs Car CO₂ Savings Calculator (Annual)
Estimate tailpipe CO₂ avoided when e-bike trips replace car trips. Defaults use EPA’s typical passenger vehicle baseline
(400 g CO₂/mile) and U.S. average grid intensity for optional e-bike charging emissions.
Enter your numbers and click Calculate.
Note: This estimates tailpipe CO₂ avoided for car miles replaced and charging CO₂ for e-bike miles (if included).
It does not include full lifecycle manufacturing emissions.
Scenario table: errands, commutes, and what the numbers look like
Assume the trip fully replaces a car trip (same origin/destination), using:
- Car tailpipe: 400 g CO₂/mile (EPA)
- E-bike charging: ~4–11 g CO₂/mile (10–30 Wh/mi, U.S. avg grid)
| Scenario (one-way) | Miles per year (round trips, 5 days/week) | Car tailpipe CO₂/yr | E-bike charging CO₂/yr | Approx CO₂ saved/yr |
| 2-mile errands (assume 5 round trips/week) | 2 mi × 2 × 5 × 52 = 1,040 mi | ~416,000 g (416 kg) | ~4–11 kg | ~405–412 kg |
| 5-mile commute | 5 mi × 2 × 5 × 52 = 2,600 mi | ~1,040 kg | ~10–29 kg | ~1,011–1,030 kg |
| 10-mile commute | 10 mi × 2 × 5 × 52 = 5,200 mi | ~2,080 kg | ~19–58 kg | ~2,022–2,061 kg |
These are order-of-magnitude estimates, but they illustrate the point: replacing thousands of car miles with e-bike miles is often a multi-hundred-kg to multi-ton CO₂ reduction per year, depending on your mileage and how consistently you substitute trips.
What changes the result most
- Trip replacement rate (the “substitution reality”)
If the e-bike replaces 30% of your short trips, your savings is roughly 30% of the “full replacement” estimate. This is the #1 lever.
1a. Trip-chaining (why 100% replacement is rare)
Many car miles come from chained trips (school → groceries → pharmacy → home). An e-bike can still replace part of that chain, but “all miles replaced” can overestimate savings unless you redesign routines (split errands, add cargo capacity, or combine transit + bike).
- Your car’s baseline (MPG, cold starts, stop-and-go)
Short car trips tend to be less efficient than highway driving, so real-world emissions can be worse than the average baseline in city conditions. - Your electricity mix (grid vs renewables)
Charging on a cleaner grid (or home solar) reduces the already-small charging emissions further. The EIA’s U.S. average is just that—an average. - Your e-bike energy use (assist level, hills, speed, cargo)
Riding fast with high assist, hauling cargo, low tire pressure, and lots of climbing pushes Wh/mile higher.
Sensitivity snapshots (how much the inputs swing the result)
Here are quick checks that show how assumptions shift results—without changing the overall conclusion.
E-bike charging emissions per mile ≈ (Wh/mi ÷ 1000) × (grid CO₂ per kWh)
Example ranges (illustrative):
- Very clean charging (renewables-heavy): e-bike stays in the low single digits g/mi
- Average U.S. grid: often single digits to low teens g/mi
- More fossil-heavy grid: can rise, but usually remains far below gas-car tailpipe per mile because the e-bike uses so little electricity
Car baseline matters too:
- A higher-MPG car lowers avoided tailpipe CO₂ per mile
- A lower-MPG SUV/truck raises it
- Short-trip driving (stop/go + cold starts) can make real-world emissions per mile higher than average
Bottom line: even when you push assumptions in “unfavorable” directions (higher Wh/mi + dirtier grid), e-bikes tend to remain dramatically lower per mile than gasoline tailpipe emissions.
The co-benefits: air, noise, and parking (why cities feel different)
Carbon is only one output of car dependence. Replacing even a slice of short car trips with e-bikes also tends to mean:
- Less local tailpipe pollution concentrated where people live, walk, and wait for buses
- Less traffic noise (especially on neighborhood streets)
- Less parking demand and less “circling,” which is wasted time and wasted fuel
These are quality-of-life benefits people feel immediately—even when climate benefits feel abstract.
Practical adoption guide: how to replace 30–60% of your short trips
If you want this to work in real life (not just in theory), focus on systems, not motivation.
Start with the “easy wins” trip list
- Grocery runs under 2–3 miles (especially with a rack or panniers)
- School drop-offs and pickups (where routes are safe)
- Commuting on days with predictable schedules
- Transit-plus-bike “last mile” trips
Make the bike “day-ready”
- Cargo: rear rack + panniers (or a small trailer) beats backpacks for comfort and safety
- Security: a solid lock + consistent parking habits matters more than brand hype
- Weather: rain shell, lights, and fenders turn “maybe” days into “yes” days
- Charging routine: treat it like your phone—top up routinely instead of running it to zero
The mindset shift that actually sticks
You do not need to replace every car trip. If you reliably replace 30–60% of your short, repeatable trips, that’s where the emissions—and cost—impact becomes meaningful.
FAQ (People-Also-Ask friendly)
- Are e-bikes really greener than cars?
Usually yes, by a wide margin per mile—especially when they replace car trips. A typical U.S. passenger vehicle emits ~400 g CO₂/mile at the tailpipe, while e-bike charging emissions are often in the single-digit to low-teens grams per mile range on the average U.S. grid. - Are e-bikes “zero emissions”?
Not in a full lifecycle sense. They can be near-zero operationally if charged with renewables, but manufacturing (especially batteries) still has emissions. - How much CO₂ can I save per year with an e-bike?
It depends on miles replaced. In many typical commuting patterns, savings can range from hundreds of kilograms to ~2+ metric tons per year when replacing thousands of car miles. - What matters more: the e-bike battery size or how often I replace car trips?
Replacement rate matters far more. A bigger battery doesn’t automatically cut emissions; it mainly affects convenience and range. - What if my electricity comes from fossil fuels?
Even then, e-bikes tend to stay low because they use very little electricity per mile. Your local grid mix still affects results, but the baseline energy demand is small. - Is an e-bike greener than an electric car (EV)?
Often yes per mile, because an e-bike typically uses far less energy per mile than any car. But EVs can still be a major improvement over gasoline cars depending on use case. - Do e-bikes still help if I only ride once or twice a week?
Yes—if those rides replace car trips you would have taken anyway. The climate benefit comes from substitution, not from owning the bike. - What’s the most realistic way to start?
Pick 2–3 repeatable short trips per week (errands, commute days, school runs), then build consistency and expand from there. - Do hills and high assist “erase” the carbon benefits?
They reduce efficiency, but it’s hard to erase the advantage because e-bikes start so low. The bigger risk is that hills reduce adoption, not that they flip the emissions math.
What’s the single biggest mistake people make with this switch?
Buying the idea of an e-bike without building the routine (secure parking, cargo plan, rain plan). Consistency is what creates real emissions reduction.