

Quick Answer: Which Are the Top Solar Power Countries in 2025?
The top five countries are China, United States, India, Japan, and Germany, based on solar power generation and installed capacity. Emerging leaders include Brazil, Australia, and Spain, each advancing solar rapidly through innovative policies and investment.
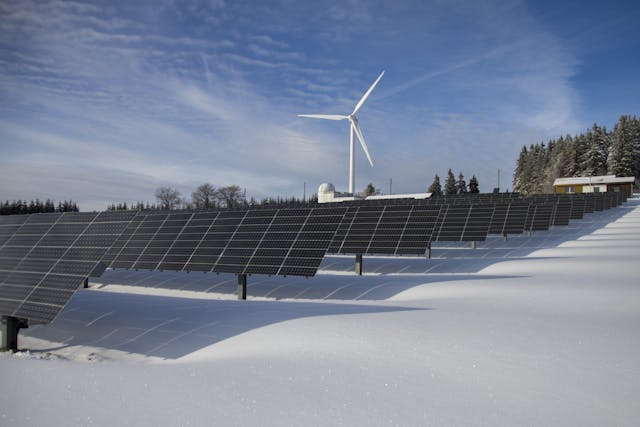
In 2025, solar power is the cornerstone of the global energy transition, with photovoltaic (PV) systems generating over 2,000 terawatt-hours (TWh) in 2024, or 6.9% of global electricity, per Ember’s Global Electricity Review 2025. Doubling from 1 TW in 2022 to 2 TW in 2024, solar capacity is skyrocketing, led by the top solar power countries. This comprehensive guide, tailored for The Environmental Blog, dives into the leading nations, their flagship projects, technological innovations, and the broader impact of solar energy, offering a roadmap for a sustainable future.
The Top Solar Power Countries in 2025
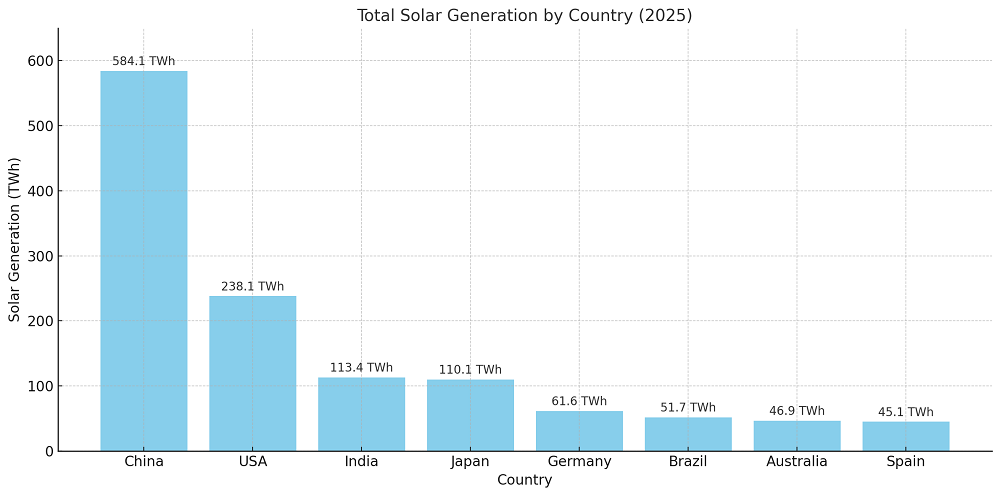
The top solar power countries in 2025, ranked by 2023 generation (TWh) with 2024-2025 updates from IRENA and X posts, are transforming energy systems. Below is a snapshot of their achievements:
| Country | 2023 Solar Generation (TWh) | 2024 Installed Capacity (GW) | Key Project |
| China | 584.15 | 887.9 | Huanghe Hydropower Hainan Solar Park |
| United States | 238.12 | 161 | Gemini Solar Project |
| India | 113.41 | 94.5 | Bhadla Solar Park |
| Japan | 110.14 | 89 | Kansai International Airport Solar Farm |
| Germany | 61.56 | 66.55 | Senftenberg Solarpark |
China: The Undisputed Leader in Solar Energy
- 2023 Solar Generation: 584.15 TWh
- 2024 Installed Capacity: 887.9 GW
- Global Share: ~35%
- Per Capita Solar: 0.63 kW/person
China’s unrivaled dominance in solar power sees it generating more electricity than the next three top solar power countries combined. Adding 278 GW in 2024, China accounts for nearly half of the global 1,865 GW capacity. Its 1,200 GW solar-and-wind target by 2030 may be met by 2025, with solar at 4% of its electricity mix. Policies like the Renewable Energy Law and $320 billion in global PV investments drive this growth, creating 2.7 million solar jobs by 2023.
Flagship Project: Huanghe Hydropower Hainan Solar Park
This 2.2 GW Qinghai project, operational since 2020, spans 5,000 hectares and includes 202.8 MW/MWh storage, powering 600,000 homes. Its desert location minimizes land conflicts, while advanced bifacial panels boost efficiency. A newer 3 GW project in Inner Mongolia, highlighted on X, underscores China’s scale. The park’s $1.2 billion investment supports local economies, though grid bottlenecks remain a challenge.
Why China Leads
China’s centralized planning, 80% share of global panel production, and innovations like floating solar (e.g., a 320 MW Anhui project) ensure leadership. However, overcapacity and land use concerns require smarter grid integration and urban solar solutions.
United States: A Strong Second Among Solar Giants
- 2023 Solar Generation: 238.12 TWh
- 2024 Installed Capacity: 161 GW
- Solar Share: 3.9%
- Jobs Created: 263,000 (2023)
The U.S., second among top solar power countries, saw solar account for 54% of new electricity capacity in 2023. California generates 28.2% of its power from solar, while Texas and Florida lead utility-scale growth. The Inflation Reduction Act’s 30% tax credit, extended to 2035, aims for 100% clean electricity, with solar targeting 377 GW by 2028.
Flagship Project: Gemini Solar Project
This 690 MW Nevada project, operational since 2024, pairs with 380 MW storage, powering 130,000 homes. Costing $1.9 billion, it uses 1.8 million panels across 2,800 acres, reducing CO2 by 1 million tons annually. Community training programs created 1,300 jobs, though wildlife habitat concerns prompted mitigation measures.
Growth Drivers
Abundant land, state mandates, and hybrid systems (18% of 2023 projects include storage) fuel growth. Grid modernization and policy stability remain hurdles.
India: Cost-Effective Solar Growth at Scale
- 2023 Solar Generation: 113.41 TWh
- 2024 Installed Capacity: 94.5 GW
- Target: 170 GW by March 2025
- Economic Impact: $15 billion annually
India, third among top solar power countries, leverages its 300 sunny days and low-cost solar (cheapest globally) to overtake Japan in 2023. With 195.11 GW projected by 2028, India’s 50% non-fossil fuel goal by 2030 relies heavily on solar, supported by the International Solar Alliance.
Flagship Project: Bhadla Solar Park
The world’s largest solar park, this 2.25 GW Rajasthan project spans 14,000 acres, powering 1.5 million homes since 2020. Its $1.4 billion cost and 10 million panels cut CO2 by 4 million tons yearly. Local water conservation efforts address desertification, though land disputes persist.
Key Factors
Subsidies, net metering, and rooftop solar drive growth, but grid reliability and financing gaps need addressing.
Japan: Innovation in Tight Spaces
- 2023 Solar Generation: 110.14 TWh
- 2024 Installed Capacity: 89 GW
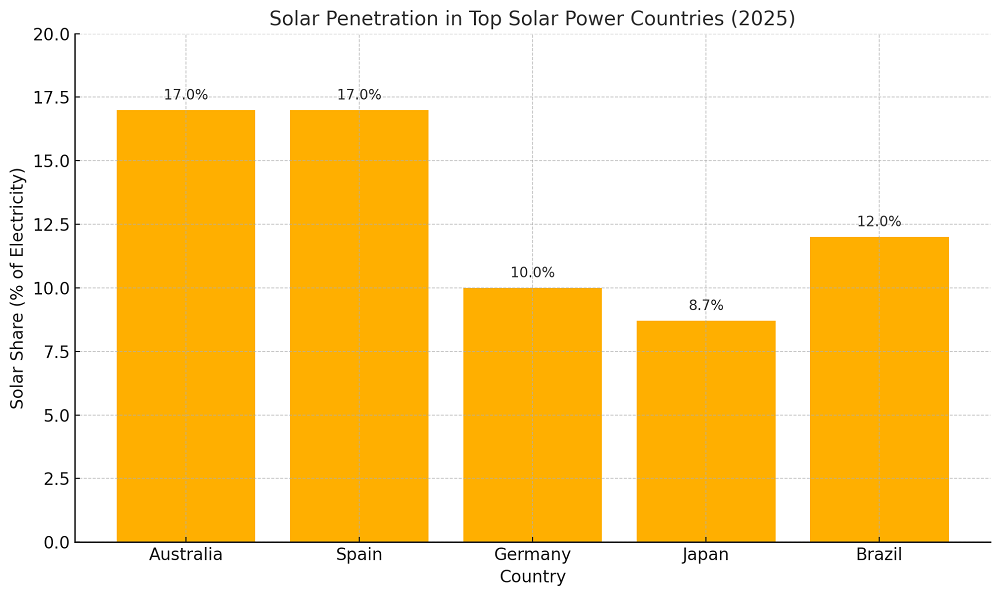
- Solar Penetration: 8.7%
- R&D Investment: $1.2 billion (2023)
Japan, fourth in the top solar power countries, maximizes limited land through innovation. A 2025 Tokyo mandate requires solar on new homes, and 50% of public buildings will have panels by 2030. Perovskite cells and floating solar are game-changers.
Flagship Project: Kansai International Airport Solar Farm
This 12 MW floating plant, operational since 2023, powers airport operations across 2.5 hectares. The 480 MW Ukujima Solar Park, set for 2026, will power 100,000 homes, reducing CO2 by 250,000 tons annually. Its offshore design minimizes land use.
Strengths
Technological leadership compensates for space constraints, though feed-in tariff cuts challenge growth.
Germany: Europe’s Solar Pioneer
- 2023 Solar Generation: 61.56 TWh
- 2024 Installed Capacity: 66.55 GW
- Solar Share: 10%
- Jobs: 150,000 (2023)
Germany, Europe’s top solar power country, drives 41.1% of its electricity from renewables via the Energiewende. Adding 7.18 GW in 2023, it targets 137.88 GW by 2028, supported by auctions and residential solar.
Flagship Project: Senftenberg Solarpark
This 166 MW Brandenburg project powers 50,000 households. The 180 MW Weesow-Willmersdorf Solar Park, operational since 2023, uses 465,000 panels, cutting CO2 by 130,000 tons yearly. Community cooperatives fund 20% of its $200 million cost.
Policy Edge
Feed-in tariffs and grid investments ensure stability, though coal phaseout lags.
Emerging Top Solar Power Countries in 2025
Beyond the top five, these nations are rising in the solar landscape:
Brazil: Latin America’s Solar Leader
- 2023 Solar Generation: 51.72 TWh
- 2024 Installed Capacity: 24 GW
- Solar Share: 12%
Brazil, where solar was the second-largest electricity source in 2022, attracted $20 billion in investments. The Pirapora Solar Complex (400 MW) powers 420,000 homes, while 196 new plants are planned with $12.5 billion. Brazil’s sunny northeast and hydropower integration drive growth, though financing barriers remain.
Australia: High Penetration Down Under
- 2023 Solar Generation: 46.91 TWh
- 2024 Installed Capacity: 26.7 GW
- Solar Share: 17%
Australia’s 17% solar penetration is among the highest globally. The Sun Cable Project, a $22 billion initiative, aims to export 4 GW to Singapore by 2030 via an undersea cable. Rooftop solar powers 3.7 million homes, but grid upgrades are needed.
Spain: Europe’s Rising Star
- 2023 Solar Generation: 45.08 TWh
- 2024 Installed Capacity: 20.5 GW
- Solar Share: 17%
Spain’s Almería Solar Platform (250 MW) uses concentrated solar power (CSP), achieving high efficiency. With 40% renewable electricity, Spain’s $2.5 billion in 2023 investments targets 39 GW by 2030, though land use conflicts arise.
Global Solar Trends Shaping Top Solar Power Countries
Solar’s meteoric rise in 2025 is driven by:
- Cost Declines: Solar costs fell 50% from 2015-2023, reaching $0.03/kWh in India, per IRENA.
- Capacity Growth: Global additions hit 447 GW in 2024, with Asia leading (54% of installations).
- Regional Shifts: Africa’s solar capacity grew 20% in 2023, with Egypt’s Benban Solar Park (1.8 GW) as a model.
- Policy Push: Over 130 countries have net-zero targets, with solar as a priority.
See global trends at The Environmental Blog’s renewable section.
Technological Innovations Powering Top Solar Power Countries
Innovations are key to solar’s growth:
- Perovskite Cells: Japan’s 26% efficiency cells promise cheaper, flexible panels by 2030.
- Bifacial Panels: Used in China’s Hainan project, they boost output by 15-20%.
- Floating Solar: Thailand’s 2.7 GW Sirindhorn project shows potential for water-scarce regions.
- Storage Solutions: The U.S.’s 10 GW of solar-plus-storage in 2024 ensures reliability.
Economic and Social Impacts of Top Solar Power Countries
Solar drives economic growth:
- Jobs: Globally, 4.9 million solar jobs in 2023, with China (2.7 million) and India (800,000) leading.
- Energy Access: India’s solar mini-grids electrified 10 million rural households by 2024.
- Affordability: Solar’s low costs save consumers $100 billion annually, per IEA.
Socially, solar empowers communities, with Germany’s 2,000 solar cooperatives involving 200,000 citizens.
Environmental Benefits and Challenges
Solar’s environmental impact is profound:
- CO2 Reduction: Offset 140 million tons in 2022, like removing 30 million cars.
- Water Savings: Solar uses 25% of agriculture’s water for similar land areas.
- Recycling: 90-97% of panels are recyclable, with a $2.7 billion market by 2030.
Challenges include land degradation (0.3% of global land for 8 TW by 2050) and panel waste (78 million tons by 2050). Solutions like brownfield sites and recycling hubs are emerging.
The Road Ahead for Top Solar Power Countries
By 2035, global solar capacity could hit 8 TW, per IEA, with top solar power countries leading:
- China: Targeting 50% renewable electricity by 2035.
- U.S. and India: Aiming for 30-40% solar penetration.
- Global Goals: Solar could meet 22% of electricity demand by 2050.
Policymakers must invest in grids, storage, and R&D, while communities adopt rooftop solar. The Environmental Blog encourages readers to advocate for local solar policies and explore personal solar solutions.
Join the Solar Movement
The top solar power countries in 2025—China, U.S., India, Japan, Germany, and emerging leaders like Brazil and Australia—are paving the way for a renewable future. Solar is more than energy; it’s a movement for sustainability, equity, and innovation. Join us at The Environmental Blog to support a sun-powered world.