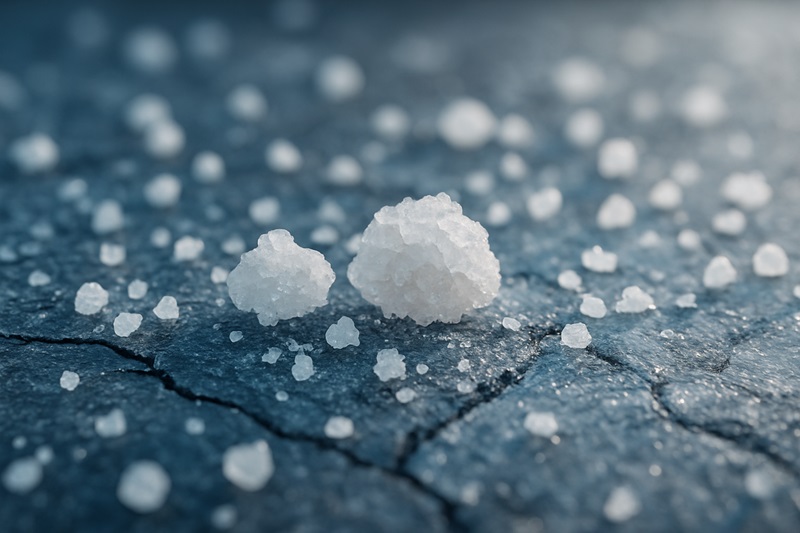

Ice melt salt does more for winter safety than most people think. Winter can look calm and beautiful, but it can also turn roads and walkways into slick, dangerous surfaces fast. A sudden cold front can make streets feel like glass and sidewalks feel unsafe.
Snowplows and grit trucks play their part, but ice melt salt does the quiet, steady work. This small mineral helps break the bond between ice and the ground, making it easier for people and cars to move safely.
From small driveways to big highways, ice melt salt is used everywhere. But there is more to it than a few grains scattered on the ground. Behind each crystal is a mix of chemistry, temperature, and safety needs. Ice melt salt is not just a simple product. It is a tool shaped by science and years of testing to keep winter travel safer for everyone.
This is the science that keeps cities moving when the world freezes.
What Ice Melt Salt Actually Does: Breaking the Winter “Ice Lock”
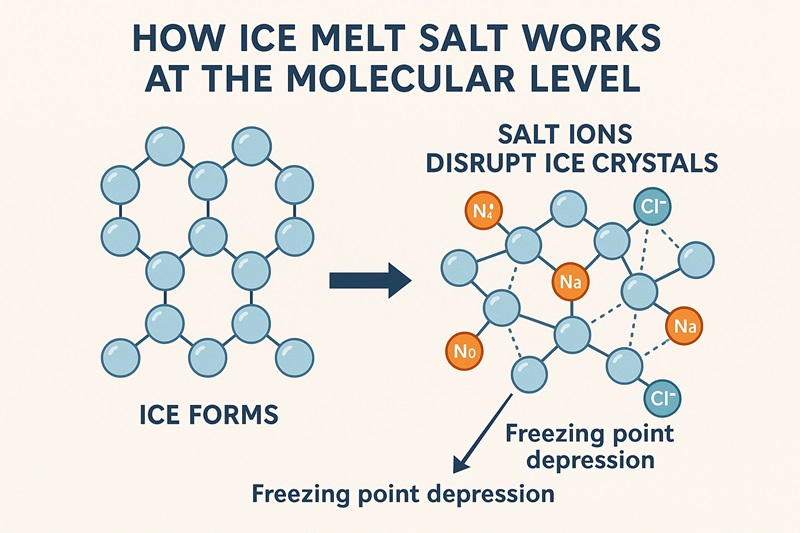
To understand ice melt salt, you must start with water—the most ordinary, yet most extraordinary chemical on Earth. Pure water freezes at 32°F (0°C), but winter rarely offers pure water or pure conditions. As soon as salt begins to dissolve into melting snow or frost, it triggers a process known as freezing point depression.
This phenomenon is beautifully simple:
- Water molecules need to align into a crystal lattice to become ice.
- Salt dissolves into charged particles (ions).
- These ions disrupt the formation of that lattice.
- The water stays liquid at temperatures where it would normally freeze.
On a molecular level, it’s as if the salt scatters tiny obstacles across the path of forming ice crystals—breaking the structure before it can harden.
Some salts go further, releasing heat as they dissolve. These “exothermic” de-icers start melting on contact, even in dangerously low temperatures. Others are “endothermic,” absorbing heat instead—effective only when a faint trace of environmental warmth is available.
This difference between releasing heat and absorbing it explains why some salts melt ice instantly while others turn sluggish when the cold becomes extreme.
Exothermic vs. Endothermic: Why Some Salts Seem to “Burn Through” Ice
Not all ice melt products are created equal. Their chemical behavior changes dramatically as temperatures dip.
Endothermic Melts: Slow, Reliable, Temperamental
Sodium chloride, or traditional rock salt, dominates global winter maintenance. It’s abundant, cheap, and adequate for average cold. But it’s endothermic—it draws heat from its environment—and when temperatures fall below 10–15°F, it starts to lose its ability to activate.
Exothermic Melts: The Powerhouses of Subzero Cold
Chemicals like calcium chloride and magnesium chloride dissolve with a release of heat—sometimes enough to feel warm on your gloves.
Their advantages are striking:
- Instant brine formation
- Effective far below zero
- Fast melting action
- Reliable under harsh freeze-thaw cycles
In deep winter, these salts don’t simply melt ice—they chemically overpower it.
The Most Common Ice Melt Salts—and the Temperatures They Dominate
Winter roads rely on a handful of salts, each with its own sweet spot. Think of them as winter tools, each one shining at a different temperature range.
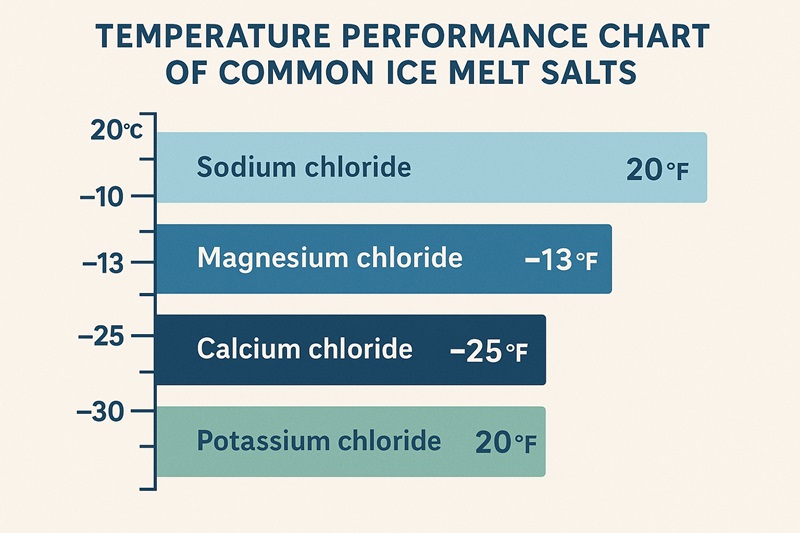
Sodium chloride—better known as rock salt—is the classic choice. Most people use it because it’s cheap and easy to find, and it works well as long as temperatures stay above about 20°F (–6°C). Once the cold becomes more intense, though, it slows down and loses much of its power.
When the weather dips far below zero, calcium chloride steps in. It’s the heavy-hitter of the group, kicking into gear even at –25°F (–32°C). This salt releases heat when it touches moisture, which is why it seems to “jump-start” the melting process. The trade-off? It can be harsh on skin and may leave its mark on certain surfaces.
Magnesium chloride tends to be the choice for homes with pets, gardens, or lots of concrete. It works down to –13°F (–25°C), and although it’s not the fastest melter, it’s kinder to surrounding vegetation and less corrosive than the harsher options.
Then there’s potassium chloride, which performs best when used as part of a blend. On its own, it stops being effective once the temperature falls near 20°F (–6°C), so people often use it when they want a milder, lower-impact treatment rather than a deep-freeze solution.
Finally, premium blends combine several salts to balance speed, safety, and cold-weather performance. The exact temperature range depends on the formula, but many homeowners like them because they reduce surface damage and melt ice faster than a single salt alone.
Ice Melt Salt Comparison
| Ice Melt Type | How Well It Handles the Cold | Where It Works Best | Real-World Advantages | Practical Drawbacks |
| Sodium Chloride (Rock Salt) | Works reliably until temps fall near 20°F (–6°C) | Driveways, city streets, everyday winter conditions | Budget-friendly, easy to find in bulk | Slows down a lot during deep cold; not ideal for harsh freezes |
| Calcium Chloride (CaCl₂) | Stays effective even at –25°F (–32°C) | Extreme-cold regions, late-night freeze events | “Heat burst” reaction starts melting fast; great for emergencies | Can irritate skin and may be rough on certain surfaces |
| Magnesium Chloride (MgCl₂) | Performs down to about –13°F (–25°C) | Homes with pets, gardens, or sensitive concrete | Gentler on vegetation, less corrosive than harsher salts | Melts ice more slowly than CaCl₂; moderate performance |
| Potassium Chloride (KCl) | Stops working near 20°F (–6°C) | Mild winters, blended products | Softer, lower-impact option when extreme cold isn’t a concern | Poor low-temperature performance on its own |
| Premium Blends | Depends on the mix; typically covers a wide temperature span | Homeowners wanting efficiency + surface protection | Balanced melting speed, reduced surface damage, solid all-around choice | Price varies; quality depends on brand and blend ratio |
Why Temperature Rules Everything
Ice melt salt doesn’t operate in a vacuum. It responds to temperature, moisture, sunlight, and pressure.
Temperature: The Gatekeeper of Melting
Rock salt slows dramatically as the air drops below 10°F.
Calcium chloride thrives where others fail.
Moisture Levels: The Hidden Variable
Salt only works when it can become brine—a salty liquid that breaks ice’s bond.
- Dry ice: slow activation
- Wet ice: instant melting
Sunlight & Dark Surfaces
Even a few degrees of radiant heat can make the difference between failure and success.
Traffic & Foot Pressure
Every vehicle tire and boot heel presses salt deeper into ice, accelerating melting.
Together, these forces turn a static winter environment into a micro-laboratory of chemical change.
How to Use Ice Melt Salt Correctly
Salt doesn’t melt faster just because you throw more at the ground. In fact, over-salting is one of the most common—and costly—mistakes people make.
Correct Application Rate
Experts recommend:
- Homeowners: ½ cup per square yard
- Parking lots / heavy ice: Adjust based on thickness
More salt does not create “more melting” once the brine saturates.
Pre-Treatment: The Secret of Municipal Success
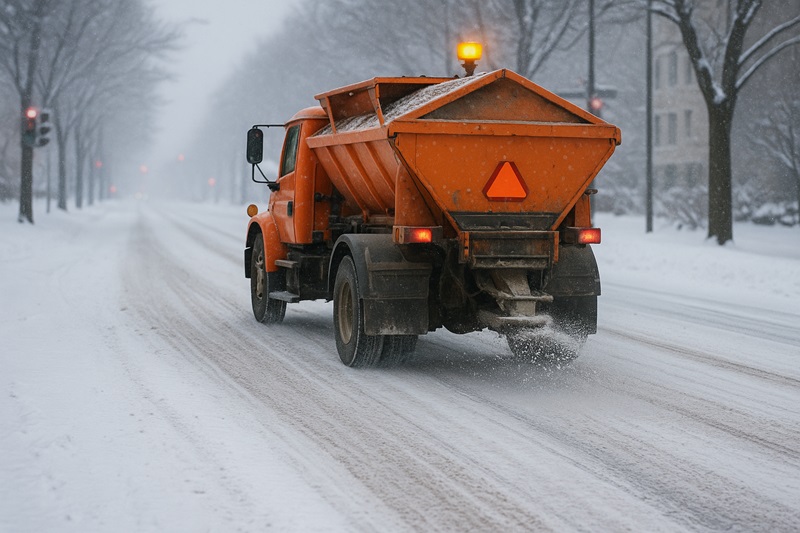
Cities across North America now pre-treat roads before storms. This creates a thin brine barrier on the pavement:
- Ice cannot form a tight bond
- Roads remain plowable
- Black ice is less likely
- Total salt use drops dramatically
This method is both safer and more economical.
Environmental and Material Damage: The Price We Pay for Safety
Salt is effective—but not harmless.
Soil & Water
Salt melts ice well, but it leaves many problems behind. In soil and water, chloride does not wash away fast. It builds up over time. This extra salt changes how soil holds water and nutrients. Plants start to feel stressed. Their roots weaken. Some plants stop growing at all.
Runoff does not stay where it starts. Melted salt water moves through drains and ditches into ponds, streams, and even groundwater. As chloride levels rise, fish, insects, and other small life forms struggle to survive. Whole water systems can fall out of balance.
Concrete Damage
Salt also harms our roads and sidewalks. When salty water slips into tiny concrete pores and freezes, it expands. This pressure pushes the concrete apart. One freeze does little, but many freeze–thaw cycles cause cracks and crumbling edges.
Corrosion
Metal takes a hit too. Salt makes rust form faster. Cars, handrails, tools, bridges, and other steel structures break down more quickly in winter. The repair costs add up fast, from small fixes at home to big city projects.
Salt keeps us safe on winter roads, but the damage it leaves behind stays long after the snow melts.
When Ice Melt Stops Working
Below certain thresholds, even the strongest salts face physical limits.
Molecular Movement Slows
In extreme cold, water molecules move too slowly for some salts to dissolve.
Brine Re-Freezes
Every salt has a eutectic point—its lowest possible melting temperature. Below this, the brine itself begins to freeze.
Mechanical Removal Becomes Mandatory
Below –25°F (–32°C):
- Shoveling
- Scraping
- Sanding for traction
- Heavy plowing
…become the primary forms of ice control.
Even chemistry has limits.
Ice Melt Salt on Roads: The Backbone of Winter Transportation
Salt is the quiet force that keeps winter roads open. On busy streets and highways, ice melt salt works in the background so cars and trucks can keep moving. It may look simple, but it is still one of the best tools for keeping roads safe when the temperature drops.
How Salt Helps Ice Lift Off the Road
Salt gets to work as soon as it touches a bit of moisture. It turns into a thin brine. This brine slides between the ice and the road. Once it does, the ice loses its grip. New ice also has a harder time sticking. Snowplows can then push the snow and ice away instead of fighting a hard, frozen layer stuck to the pavement.
The Types of Ice Melt Salt Cities Use
Road crews use different salts based on the weather.
Rock salt is the most common because it is cheap and reliable.
When it gets colder, crews switch to calcium chloride because it gives off heat and works faster.
Magnesium chloride is used in busy areas where people worry about soil and plant health, since it is easier on the environment.
Many cities also spray liquid brine before a storm to stop ice from forming in the first place.
What Happens When It Gets Too Cold
Salt cannot work well in extreme cold. Once the air falls below –20°F, melting slows a lot. When that happens, crews change their plan. They scrape the roads more often. They spread sand to help cars get traction. They also use liquid anti-icers to slow the formation of black ice. Plows run more often, relying on force instead of salt until the weather warms up.
Choosing the Right Ice Melt Salt
Best for Extreme Cold:
Calcium chloride
Fastest melt, most reliable below 0°F.
Best for Driveways and Sidewalks:
Magnesium chloride
Gentler on concrete, plants, and pets.
Best Budget Option:
Rock salt (sodium chloride)
Affordable, effective above ~15°F.
Best Eco-Friendly Option:
CMA (Calcium Magnesium Acetate) or blended “green” melts
Low corrosion, safe for vegetation.
Best Pet-Safe Option:
Magnesium chloride or organic blends
Lower burn risk, smoother granules.
Common Mistakes People Make With Ice Melt
Even well-intentioned homeowners misuse salt.
Here are the most frequent errors:
- Applying salt before clearing snow
- Dumping excessive salt on one spot
- Using rock salt in extreme cold
- Mixing incompatible chemicals
- Failing to store salt airtight
- Using salt on newly poured concrete
- Forgetting to reapply after heavy traffic
Avoiding these mistakes increases safety while reducing damage and cost.
Pet Safety: Protecting Paws in Winter
Some salts irritate paws due to alkaline pH or sharp granules.
To protect animals:
- Choose magnesium chloride blends
- Use dog booties
- Wash paws after walks
- Lay down protective mats near entrances
Pets rely on human attention to stay safe in winter environments.
How to Store Ice Melt Properly
Salt is hygroscopic—it absorbs moisture from the air.
Store it in:
- Airtight containers
- Cool, dry areas
- Elevated surfaces away from concrete floors
Clumped salt loses effectiveness and spreads unevenly.
FAQ
Does ice melt salt work below zero?
Yes—calcium chloride and magnesium chloride remain effective in subzero temperatures.
Is ice melt bad for concrete?
Chloride salts accelerate freeze–thaw damage over time.
What is the safest ice melt for pets?
Magnesium chloride and organic pet-safe blends.
How long does ice melt take to work?
Anywhere from 5–20 minutes depending on temperature, salt type, and ice thickness.
Is rock salt the same as ice melt?
Rock salt is one type. Blends perform better in extreme cold and offer improved safety.
Conclusion: The Invisible Chemistry That Makes Winter Livable
Winter feels safer because of a simple bit of chemistry. Every clear sidewalk and open road depends on how salt reacts with ice and cold. Ice melt salt may look plain, but it plays a huge role in keeping daily life moving.
When we know how each type of salt works—and when it stops working—we can use it in smarter, safer ways. With the right choices, winter becomes easier to handle. It shows how tiny salt crystals can make a big difference, helping cities keep going even when the world freezes.
Meta: