

If your royalty checks drop after the first few months, that’s usually not a problem—it’s the expected shape of production. A “decline curve” is simply the pattern of how a well’s production rate changes over time. The trick is learning what’s normal, what’s noise, and what’s a real red flag.
Why your first checks feel “too good to be true”
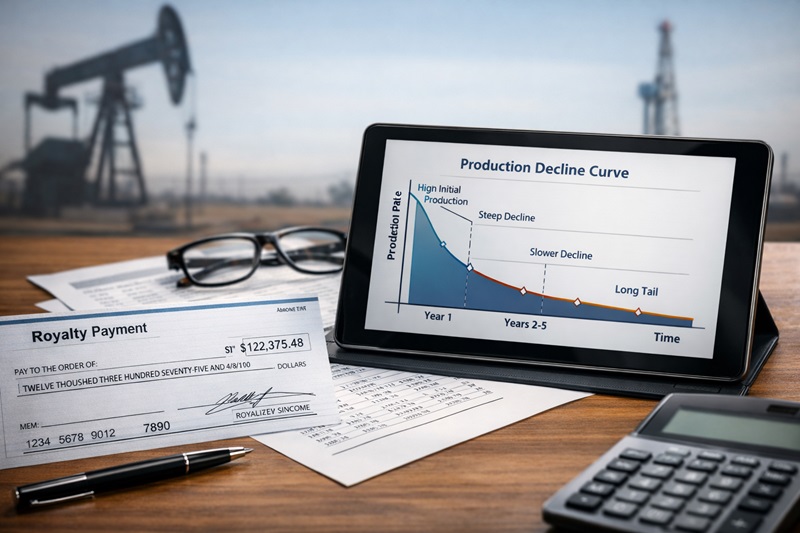
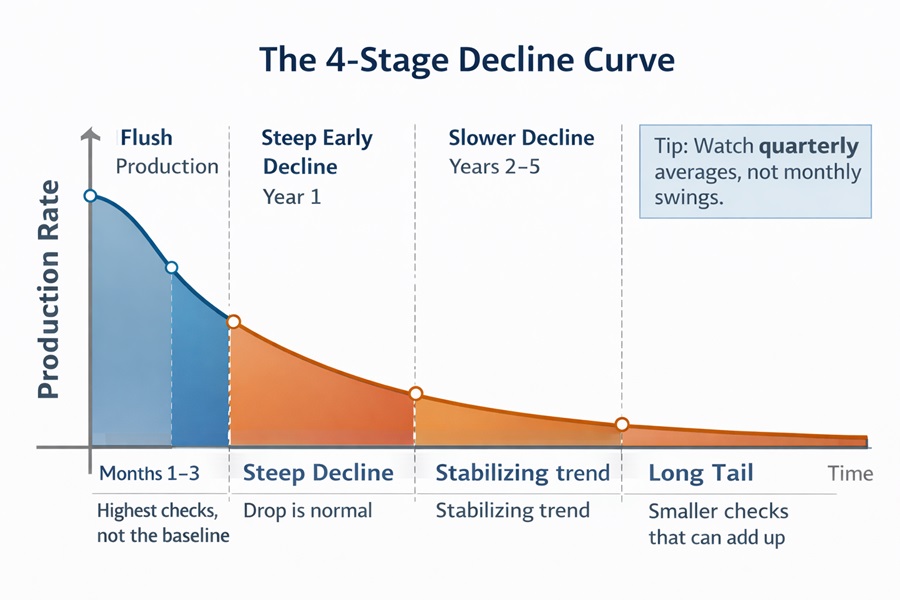
Most modern horizontal shale/tight wells behave like this:
- High early production (the “flush” period)
- A steep decline in the first year
- A slower decline afterward
- A long tail of lower, steadier production that can last many years
That steep early drop is common across many unconventional plays. The exact percentage varies by basin, well design, and the year the well was drilled—so treat any single number as a rule of thumb, not a promise.
A simple way to think about it:
Early months are the loudest. The later years are quieter—but often where the long-run value comes from.
What a decline curve is
A decline curve is a line (or curve) on a chart showing production rate over time—how many barrels of oil (or mcf of gas) a well produces per day/month as time passes.
In petroleum engineering, people often fit production history using common “decline curve analysis” models (you may hear terms like exponential or hyperbolic decline). You don’t need to be an engineer to benefit from the idea: the shape helps you set expectations.
Important: production decline ≠ royalty check decline
Royalty checks usually follow production, but checks also change for reasons that have nothing to do with the rock.
Your check can drop because of:
- Commodity price changes (oil/gas price)
- Differentials (local price vs benchmark)
- Downtime/curtailment (pipeline constraints, maintenance, weather)
- Post-production deductions (depending on lease language and state norms)
- Allocation/decimals (unit changes, title corrections, suspense releases)
- Timing/reporting lag (month-to-month noise)
So: a smaller check might reflect lower production, lower net price, higher deductions, or just timing.
A quick example (why month-to-month comparisons drive anxiety)
Imagine a well whose oil volumes decline fast at first, then slow down:
| Month | Oil sold (bbl) | What it “feels” like |
| 1 | 10,000 | “This will be amazing forever.” |
| 3 | 6,500 | “Something broke.” |
| 6 | 4,500 | “It’s still dropping.” |
| 12 | 3,200 | “It’s stabilizing.” |
| 24 | 2,400 | “Steady, not exciting.” |
| 60 | 1,600 | “Small checks… but still arriving.” |
Now add pricing reality:
- If oil price drops 20% while production drops 20%, your check can drop ~36% (0.8 × 0.8 = 0.64).
- If production drops but price rises, your check might not drop much—or could even rise.
That’s why looking only at the check amount can be misleading. Track volumes, price, and deductions separately.
The long tail: where stability lives
After the early steep decline, many wells enter a “tail” phase: lower production that declines more slowly.
Why that matters for owners:
- Early checks can be large but temporary.
- Later checks can be smaller but predictable.
- Over many years, that tail can add up—especially if commodity prices rise at times.
Owners who understand this stop treating the first months as the “baseline.” The baseline is usually closer to what the well does after it settles.
Why two wells in the same area can look different
Even within one county, decline shapes vary because of:
- Rock quality and thickness
- Pressure and fluid behavior
- Lateral length and landing zone
- Completion design (stages, proppant, spacing)
- Interference from nearby wells (parent/child well effects)
- Operational constraints (midstream, lift, downtime)
Best practice: compare your well to nearby wells of similar vintage and design, not national averages.
Common mistakes royalty owners make
1) Assuming the well is “failing” after the first drop
Most unconventional wells drop sharply early. That’s expected behavior, not automatically a problem.
2) Comparing one month to the next
Monthly numbers are noisy. Quarterly and annual views are more meaningful.
3) Treating the first check as the “normal check”
The first checks often reflect a peak period.
4) Ignoring the “checks vs production” breakdown
A lower check might be pricing, deductions, or downtime—not just production decline.
5) Selling purely because of the initial decline
Selling can be right for some people, but “the first drop” by itself is not enough information to decide.
Actionable ways to use decline curves (no engineering required)
Step 1: Track the right data (simple spreadsheet)
Each month, log:
- Oil volume
- Gas volume
- NGL volume (if shown)
- Days on production (if available)
- Average sales price (net price on check detail)
- Total deductions
- Your net revenue interest / decimal
Step 2: Review quarterly, not weekly
Quarterly totals smooth out noise and reduce stress.
Step 3: Build a “local reality check”
Find 5–10 nearby wells (same formation, similar start date if possible) and compare:
- How fast did they drop in year 1?
- When did they “settle”?
- What does year 3–5 look like?
If you work with an operator, landman, or local technical team—whether that’s G2 Petroleum Texas or another group active in your area—ask for nearby-well production histories or type-curve context so you’re comparing your well to the right local peers.
Step 4: Budget off the stabilized phase
When planning household budgets, use conservative expectations based on:
- months 12–24 (often more representative than months 1–3)
- plus price caution (assume prices can swing)
Step 5: Do an annual “health check”
Once a year, ask:
- Are volumes declining in a way similar to nearby wells?
- Any long shut-in periods?
- Did deductions spike unusually?
- Any decimal/ownership changes?
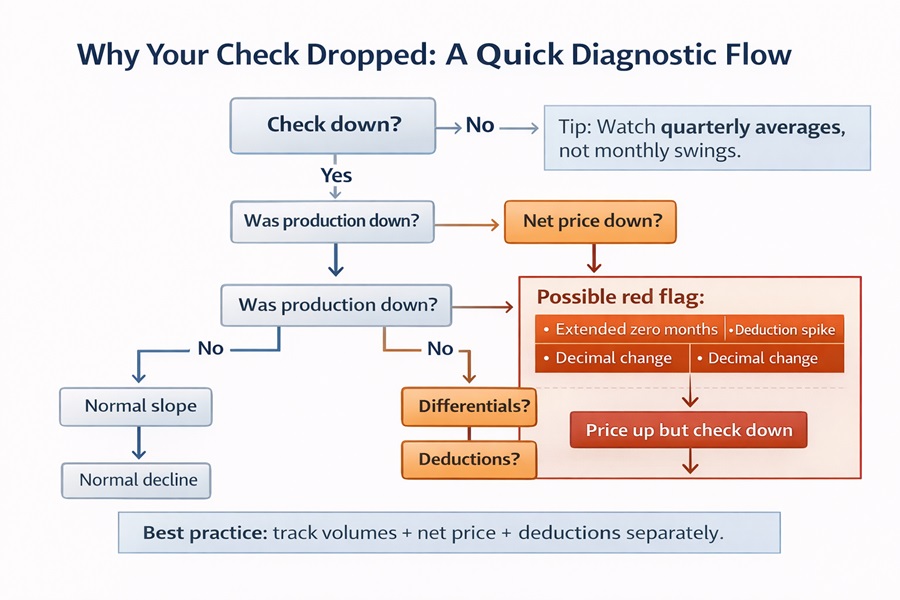
When the decline curve story might NOT be “normal” (red flags)
Decline is expected. But these are worth investigating:
- Sudden step-change down that does not recover (not a gradual slope)
- Extended zero-production months with no explanation
- Big deduction changes without clear line-item support
- Decimal interest changes you don’t understand
- Unit/well list changes (new wells added) that affect allocation
- “Price up, check down” driven by net price collapse or deductions
If you see a red flag, start with the check detail and production statement, then verify volumes via the state regulator’s database (where applicable).
Technology doesn’t cancel decline (it often front-loads it)
Modern completions can make early production higher and earlier months “louder.” That can be good—but it doesn’t remove the physics of depletion. In many cases, better tech changes timing more than it changes the existence of decline.
A neutral decision framework if you’re thinking about selling royalties
Selling isn’t automatically good or bad. The right answer depends on your goals and constraints.
Consider:
- Time horizon: do you need cash now or value over time?
- Risk tolerance: can you live with price swings?
- Tax/estate planning: proceeds vs ongoing income
- Concentration: is this your only asset or one of many?
- Offer quality: does the offer reflect conservative long-term value, or does it assume the best-case?
If you sell, you’re usually trading long-term uncertainty for immediate certainty. Make that trade intentionally, not out of panic.
FAQ
Are declining checks a sign my well is dying?
Usually no. Many wells decline quickly early, then slow down. Look for gradual slope vs sudden abnormal drops.
How long do royalties last?
As long as the well produces in paying quantities and remains active—this varies widely by well economics and operations.
Why did my check drop even though oil/gas prices rose?
Common reasons: lower volumes, higher differentials, higher deductions, downtime, or reporting timing.
Should I track checks or production?
Both—but production volumes are the cleaner signal. Checks mix production + pricing + deductions.
Final thoughts
Decline curves aren’t warning signs—they’re expectation-setting tools.
Once you understand the shape—early flush, steep decline, then a long tail—you stop treating every smaller check like an emergency. You start reading your royalties like a long-running income stream with normal variability, not a straight-line salary.
Clarity doesn’t eliminate volatility—but it replaces panic with informed decisions.