

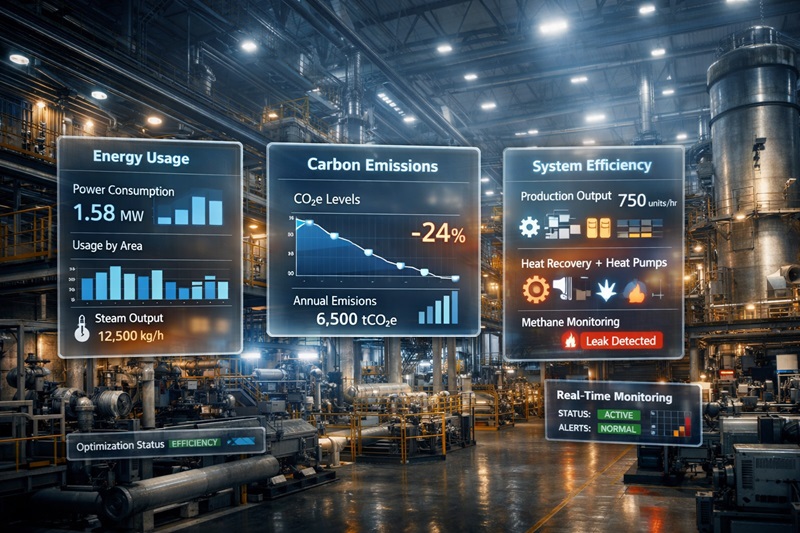
Industrial companies are caught in a tight spot: Energy costs and expenses keep on fluctuating while Expectations around carbon emissions just keep rising – as a result of tougher regulations, supplier contract requirements, and customers who are watching what you’re doing. The good news is that being greener and staying competitive no longer need be mutually exclusive goals. In fact, you’ll often see the quickest carbon reductions coming from the very same steps that also trim waste, downtime and energy bills.
What’s changed here isn’t some kind of single magical breakthrough – it’s the Stacking up of advantages: affordable sensors, better controls, more frequent data-flow and those engineering solutions (heat recovery, heat pumps, swapping out fuel inputs for electricity, where it makes sense to do so) that in the end make financial sense in real-world plants – not just in brand-new builds. Digitalisation helps highlight areas where you’re losing out; then engineering upgrades can go in and actually sort out those losses. And having a clear, third-party-checked record of your progress (the sort of thing that can actually be put on a balance sheet) makes it a whole lot easier to get financing.
What this article covers, and what it leaves out
Covers: Some practical, tech-based paths to reducing emissions/energy bills during day-to-day operations. This includes the sort of emissions and energy performance that comes under Scope 1 (that’s direct fuel/methane use) and Scope 2 (purchased electricity and heat/steam). It includes some practical guidance and metrics to get you started.
Doesn’t get too deeply into:
Product redesigns, and the impact of all those earlier steps on the broader value chain (Scope 3). If that’s what you need, get a hold of the GHG Protocol Scope 3 Standard – a framework that’s already been widely adopted.
Start with the same definitions that your executives, auditors, and other stakeholders all agree on
If you want to be able to claim you’re doing a certain thing, and then have it stand up to scrutiny by your procurement team, your lenders, and regulators, then stick with the basics:
- GHG Protocol (Corporate Standard): This is the standard way to set your boundaries and account for Scope 1 and Scope 2 emissions.
- ISO 14064-1: Some fundamental principles and requirements for working out and reporting on your own GHG emissions, and for making sure any results you share are credible.
- ISO 50001: A framework that will help you set up a real energy management system (EnMS) to systematically sort out your energy use.
These don’t make the whole job for you, but they will help make your measurement, baselines and other claims rock solid and defensible.
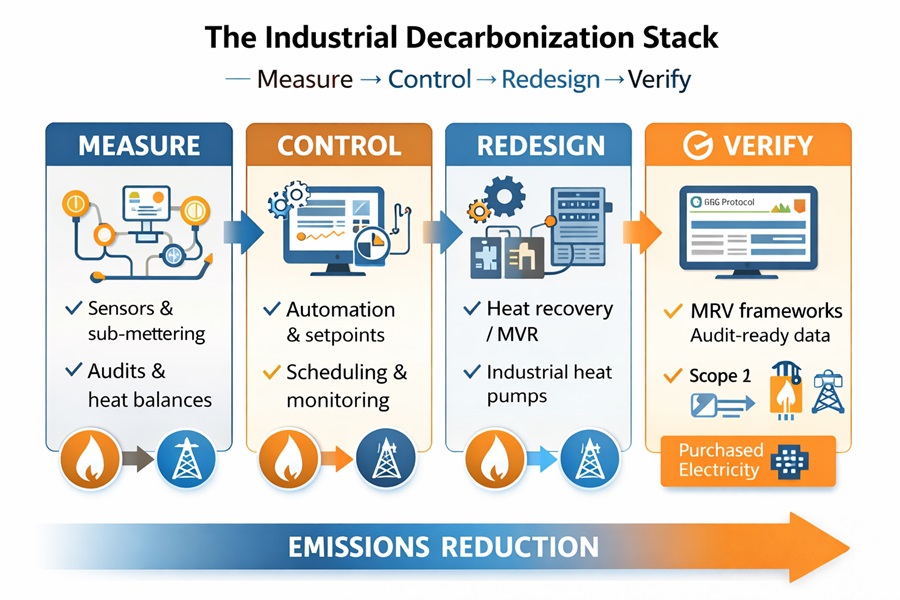
The basic formula: measure, control, redesign
Just about every single industrial decarbonisation win has followed this same sequence:
- Get a handle on what’s really important (sub-metering, checks on your heat / steam balance, compressed air, flaring / methane – wherever that’s relevant).
- Cut waste right now (Automation, scheduling, setting the right levels for processes, and keeping your gear in top nick with predictive maintenance).
- Sort out your systems that are really losing you money (heat recovery, swapping out fuel for electricity or with heat pumps, upgrading the gear you use).
- Verify it, make it stick and get it funded (so that your results keep coming through over time, and get put to good use).
Tech map: which levers really cut which emissions?
| Technology lever | Typical impact | Emissions it usually affects most |
| Digital energy monitoring, controls, scheduling | Cuts “invisible” kWh/steam losses; stabilizes operations | Mostly Scope 2, sometimes Scope 1 via better combustion/steam efficiency |
| Heat recovery + process integration | Reuses waste heat; reduces boiler duty | Mostly Scope 1 (fuel), sometimes shifts to Scope 2 if electrified |
| Industrial heat pumps / electrified process heat | Replaces gas heat with electricity + recovered heat | Scope 1 down, Scope 2 may rise (but can be low-carbon with clean power) |
| Continuous methane / flare monitoring + LDAR digitization | Finds leaks fast; reduces flaring and product loss | Mostly Scope 1 (methane + combustion) |
| MRV / emissions data platforms | Makes reduction claims audit-ready; supports compliance and financing | Enables reporting/credits; doesn’t reduce by itself |
Use case 1: Smarter energy management in manufacturing (retrofit, not rebuild)
Problem: Manufacturing sites often have “known unknowns”—you see the monthly utility bill, but you can’t tie energy to processes, shifts, and equipment. That makes waste look like a fixed cost.
What works: Digital monitoring (sub-metering + connected sensors) paired with operational controls and targeted upgrades (lighting, controls, HVAC/boilers where applicable).
example: ABB Dalmine (Italy) — modern efficiency in a decades-old site
ABB has published multiple updates on its Dalmine facility showing how digitalization and upgrades were applied to an older plant. A 2022 ABB release reports a 25% reduction in carbon emissions across the facility tied to tech upgrades and digitalization.
A later ABB story (2025) positions the 46-year-old site as a sustainability showcase, reinforcing the key point: you can retrofit legacy assets rather than waiting for greenfield builds.
How to make this section more “industrial-grade”: what to measure and what to change
- Meter by system: compressed air, chillers/refrigeration, ovens/furnaces, HVAC, process steam, major motor lines.
- Normalize: energy per unit output (kWh/ton, GJ/ton, kWh/unit) so efficiency isn’t confused with production swings.
- Lock in controls: weekend/overnight shutdown schedules, demand limiting, setpoint governance, alarms for drift.
KPIs to publish internally
- kWh per unit output; peak demand (kW); idle-time energy; % equipment time in “optimal band”; maintenance-triggered energy anomalies.
Use case 2: Heat recovery and electrified process heat in food processing (where ROI is often fastest)
Problem: Food and beverage plants are heat-intensive (evaporation, pasteurization, hot wash). Traditional designs dump usable heat and then burn gas to re-create it.
What works:
- Mechanical Vapour Recompression (MVR): reuses vapor energy in evaporation.
- Industrial heat pumps: capture waste heat (often from refrigeration) to produce hot water.
example A: New Zealand Sugar — MVR evaporation upgrade
New Zealand’s EECA documents the MVR evaporator case with specific performance outcomes: ~7x more energy efficient than the prior system, ~10% gas reduction relative to a 2022 baseline, and ~2,000 tonnes of CO₂e saved annually.
Alfa Laval’s case material describes the same MVR mechanism and provides comparative energy intensity values for MVR vs older systems.
example B: Goodman Fielder (NZ) — heat pumps using refrigeration waste heat
EECA has also published on Goodman Fielder’s process heat shift, including targets around gas reduction and emissions cuts (~1,200 tCO₂/year) through heat recovery and heat pumps integrated with refrigeration waste heat.
Why these projects tend to pencil out
- Heat loads are steady and high (good capacity factor).
- Waste heat sources (refrigeration) are already “paid for.”
- Gas displacement is measurable, which makes MRV cleaner.
KPIs to track
- Boiler gas per tonne product; heat pump COP; recovered heat (kW/kWh); hot-water demand coverage (%); steam loss rate; condensate return (%).
Use case 3: Digital emissions management in oil & gas (methane and flaring are operational losses)
Problem: Methane leaks and flaring are both environmental liabilities and lost product. Periodic inspections can miss transient leaks; manual reporting can lag reality.
What works:
- Continuous monitoring + faster LDAR workflows (sensors, analytics, automated alerts).
- Flare monitoring and operational optimization (reduce unnecessary flaring events).
- MRV integration so emissions data is consistent for compliance and corporate reporting.
Industry signal: Aramco + SLB digital sustainability collaboration (MRV + flare monitoring focus)
SLB and Aramco announced collaboration to develop digital sustainability solutions that streamline measuring, reporting, and verifying emissions, including flare monitoring and optimization solutions—an indicator that MRV + operational tooling is becoming core infrastructure, not a side project.
Authority upgrade (important): avoid over-claiming production/emissions miracles
Unless you can cite a named operator, baseline year, and whether reductions are absolute or intensity-based, avoid headline numbers like “300% production increase with 70% emissions reduction.” The credible version is: continuous monitoring reduces time-to-detection and time-to-repair, cutting methane and flaring while improving uptime and maintenance efficiency. In practice, this trend is pushing oil and gas software development toward platforms that combine operational telemetry with emissions MRV—so compliance reporting and performance optimization share the same source of truth.
KPIs to track
- Methane leak rate; time-to-detect; time-to-repair; flare volume and flare events; % assets covered by continuous monitoring; verified emissions uncertainty bounds.
Implementation considerations (what makes projects succeed globally)
1) Data foundations (baseline is not optional)
Projects outperform when companies do the “boring work” first:
- Energy and mass/heat balances by process area
- Metering plan (what, where, sampling frequency, calibration)
- Emissions factors aligned to reporting needs (Scope 1 vs 2, location vs market-based where relevant)
This is also where ISO 50001 thinking helps: define baselines, governance, and continual improvement rather than one-off retrofits.
2) Skills, safety, and change management
- Train operators on new controls and alarms (avoid “override culture”)
- Build in maintenance workflows so sensors don’t become “dead data”
- In heavy industry, integrate safety and operational risk reviews early
3) Cybersecurity + interoperability (common global blocker)
Plants often struggle with OT/IT integration. Reduce risk by:
- Segmented networks for OT
- Clear ownership of data pipelines
- Preference for interoperable standards to avoid vendor lock-in
4) System thinking beats single gadgets
Heat recovery pairs with insulation and condensate return. Monitoring pairs with control governance. The biggest, stickiest wins come from bundles designed around a process.
A practical roadmap (30 / 90 / 180 days)
First 30 days: find the biggest losses
- Identify top 3 energy systems by cost (steam, refrigeration, compressed air, furnaces)
- Add quick sub-metering where gaps exist
- Establish baseline KPIs (per unit output)
By 90 days: lock in operational controls
- Scheduling + shutdown automation
- Setpoint governance + alarms for drift
- Maintenance + energy anomaly workflow
By 180 days: execute capex where ROI is proven
- Heat recovery / heat pump design package
- Evaporator upgrades (food) or process integration (chemicals)
- Methane/flaring continuous monitoring pilots (oil & gas)
How to quantify impact (simple, defensible)
- Energy saved (kWh, GJ, therms) × emission factor → CO₂e reduced
- For methane: measured leak reductions converted to CO₂e using your reporting method
- Always state:
- baseline period (e.g., “2022 calendar year”)
- boundary (Scope 1/2, site-wide vs process area)
- whether results are absolute or intensity-based
This aligns with established accounting approaches in GHG Protocol/ISO frameworks.
Conclusion: technology is now a competitive advantage, not a tradeoff
Across manufacturing, food processing, and oil & gas, the pattern is consistent:
- Digital monitoring turns energy and emissions from a lagging monthly number into an operational variable you can manage. (IEA’s work supports the efficiency upside from digitalization and data-driven control.)
- Heat recovery and electrification (heat pumps/MVR) convert waste heat into useful work—often delivering payback while cutting fuel use, as shown in EECA and supplier case documentation.
- Emissions data platforms and MRV tooling are becoming standard infrastructure for hard-to-abate sectors, with major players explicitly investing in flare monitoring and emissions verification workflows.
For global industrial leaders, the strategic takeaway is straightforward: start with measurement and governance, move to high-frequency controls, then invest in process-level redesign where heat and losses are concentrated. The organizations that do this well will win twice—on cost and on carbon credibility.